What SDKs Do Top Apps Use? A 2026+ Looking Breakdown

Choosing the right SDKs has never been more critical for mobile developers. As app ecosystems mature and competition increases, SDK decisions now shape everything from monetization efficiency to data accuracy and global scalability.
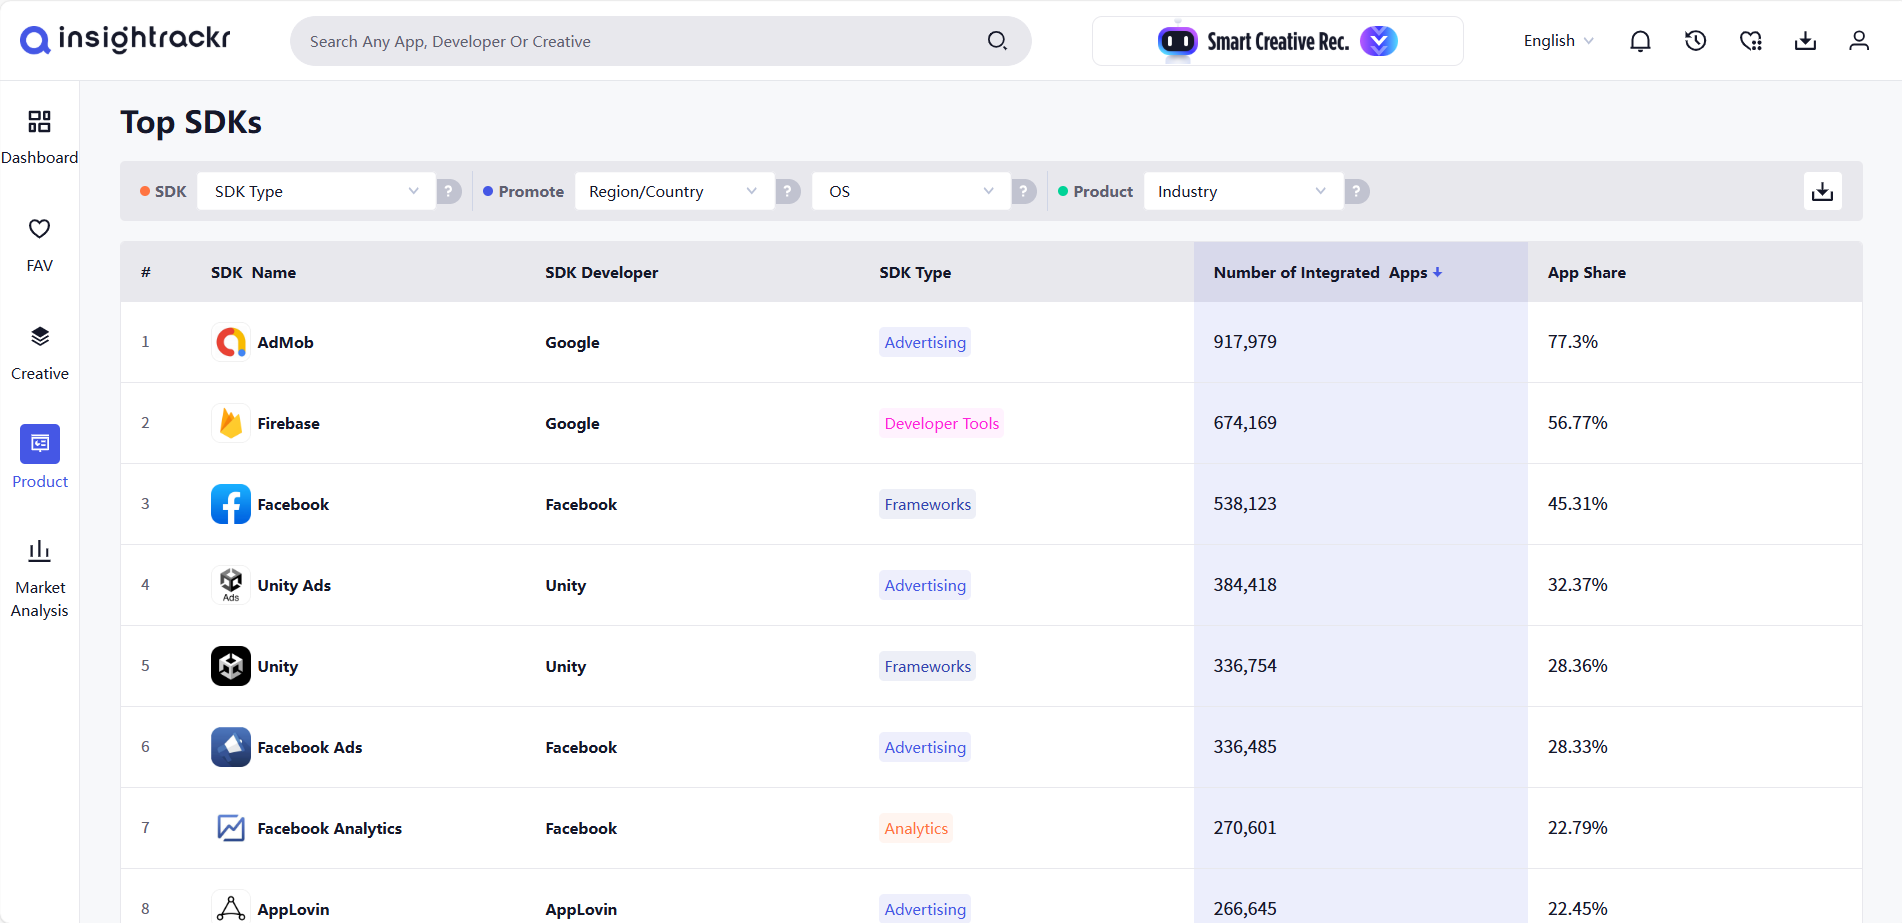
To help developers navigate this complexity, we analyzed SDK adoption across gaming and non-gaming apps using Insightrackr’s global monitoring data.
The result: a clear, forward-looking breakdown of which SDKs dominate today—and which trends will define 2026 and beyond.
Why SDK Choices Matter More in 2026+
As privacy rules tighten, ad formats evolve, and in-app monetization diversifies, the SDK stack behind an app increasingly determines:
- Ad earnings and eCPM stability
- Attribution accuracy across privacy-restricted platforms
- User experience and app performance
- Compliance readiness for global markets
- Technical scalability across platforms and regions
Insightrackr’s SDK monitoring across 148 regions and 200+ ad networks provides a real-world view of the tools top-performing apps rely on.
Current State of SDK Usage
1. Advertising SDKs
Gaming Apps: AdMob + Unity Ads remain the dominant pairing
According to Insightrackr, the Top 5 advertising SDKs in gaming apps are:
| Rank | SDK | Penetration Rate |
|---|---|---|
| 1 | AdMob | 72.95% |
| 2 | Unity Ads | 53.37% |
| 3 | AppLovin | 35.56% |
| 4 | Facebook Ads | 32.81% |
| 5 | ironSource | 28.15% |
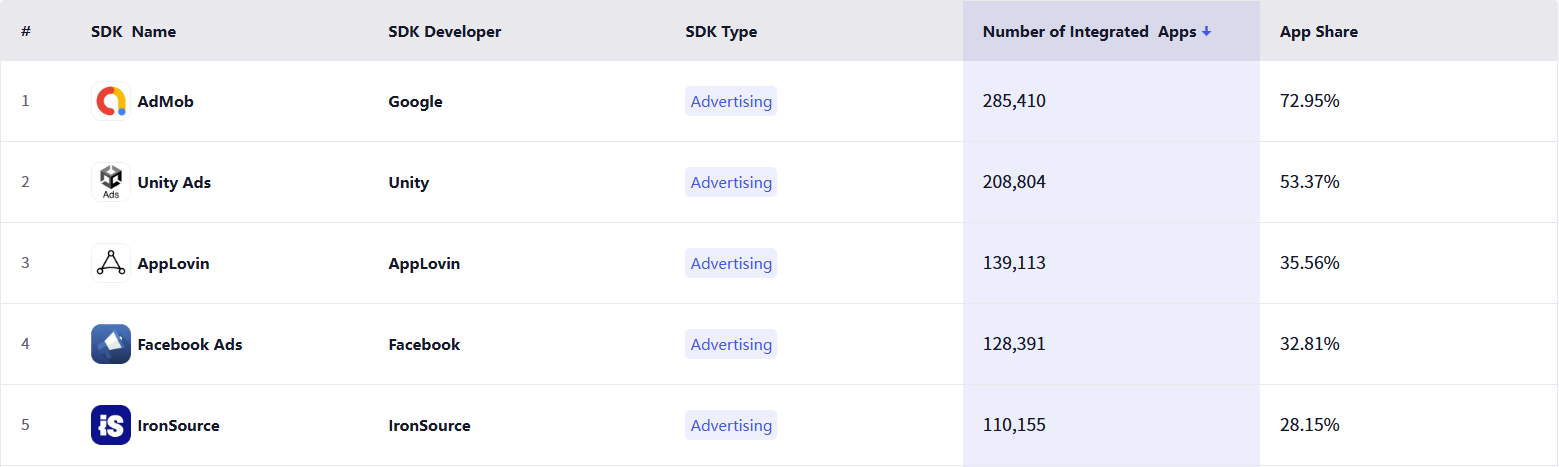
Unity’s continued relevance—despite developer frustrations in 2023–2024—highlights the SDK’s central role in hybrid-casual and mid-core monetization. AppLovin and ironSource retain strong adoption in studios built around aggressive user acquisition cycles.
Non-Gaming Apps: AdMob dominates even more strongly
| Rank | SDK | Penetration Rate |
|---|---|---|
| 1 | AdMob | 79.41% |
| 2 | Facebook Ads | 26.14% |
| 3 | AppLovin | 14.9% |
| 4 | Unity Ads | 14.5% |
| 5 | ironSource | 8.02% |
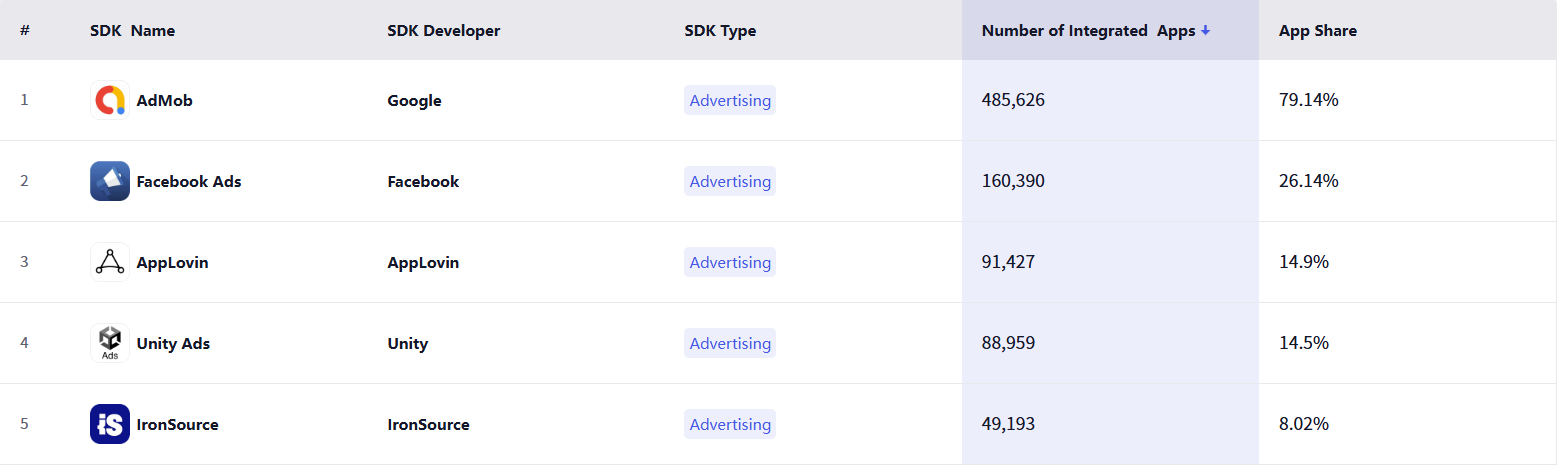
AdMob’s larger lead in non-gaming reflects Google’s ecosystem advantage and a shift toward simpler monetization stacks among lifestyle, utility, and entertainment apps.
2. Attribution SDKs
Gaming: AppsFlyer maintains a commanding lead
| SDK | Penetration Rate |
|---|---|
| AppsFlyer | 18.68% |
| Adjust | 14.05% |
| MyTracker | 3.74% |
| Tenjin | 3.25% |
| AppMetrica | 3.25% |
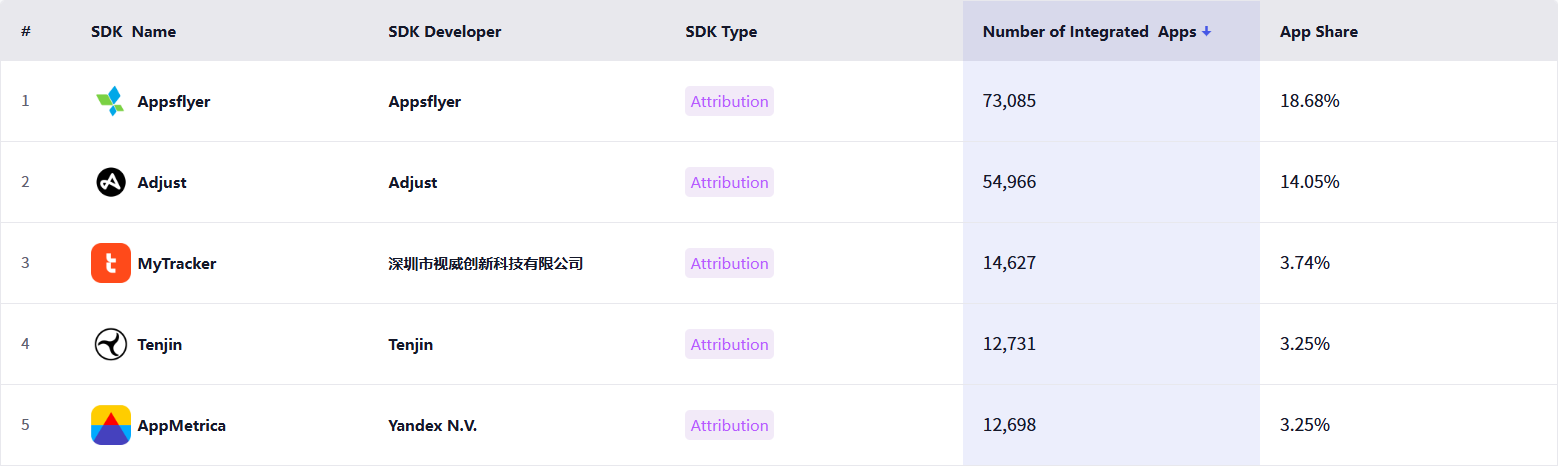
Gaming studios continue to rely on multi-touch attribution from AppsFlyer and Adjust despite privacy tightening. The long tail of niche tools highlights a fragmented UA strategy for global publishers.
Non-Gaming: Lower attribution SDK adoption overall
| SDK | Penetration Rate |
|---|---|
| AppsFlyer | 6.96% |
| Adjust | 4.32% |
| Branch | 1.94% |
| AppMetrica | 1.12% |
| MyTracker | 0.85% |
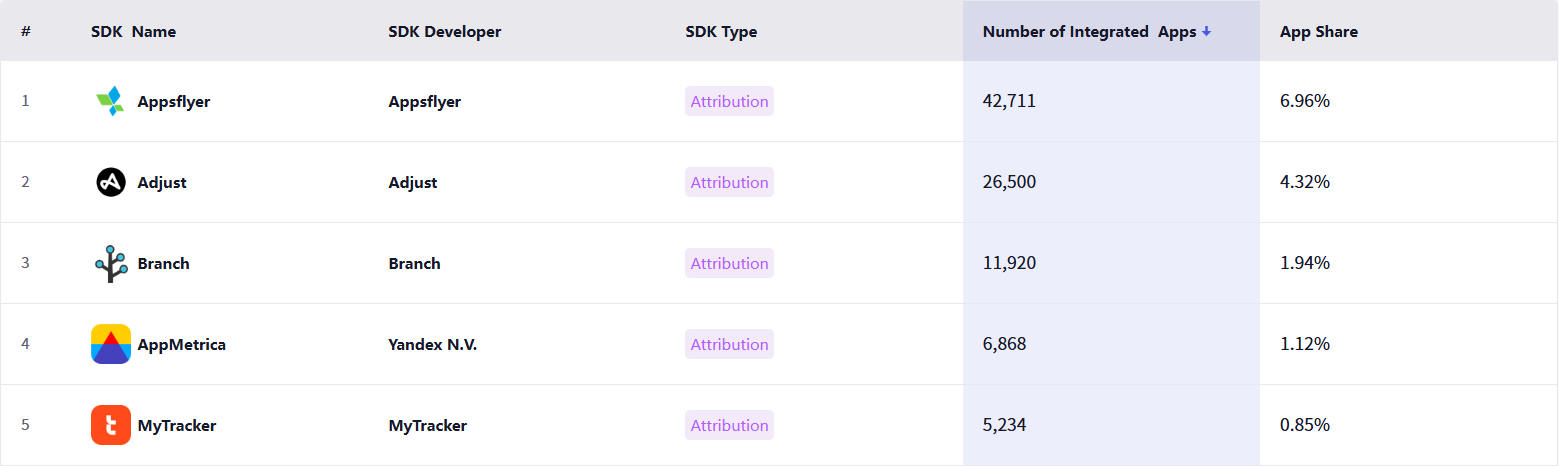
Non-gaming apps often depend more on platform analytics and internal BI tools, resulting in lower market penetration for standalone attribution platforms.
3. Payment SDKs
Across both gaming and non-gaming, Square emerges as the most widely integrated payment SDK, driven by its lightweight implementation and broad geographic availability.
Gaming Apps
| SDK | Penetration Rate |
|---|---|
| Square | 17.25% |
| 云闪付 (UnionPay) | 0.71% |
| Braintree | 0.1% |
| Stripe | 0.1% |
| PayPal | 0.05% |

Gaming remains heavily dependent on platform-native IAP channels, explaining the relatively low penetration of third-party payment SDKs.
Non-Gaming Apps
| SDK | Penetration Rate |
|---|---|
| Square | 25.36% |
| Stripe | 1.99% |
| Braintree | 0.7% |
| PayPal | 0.55% |
| Shopify | 0.34% |
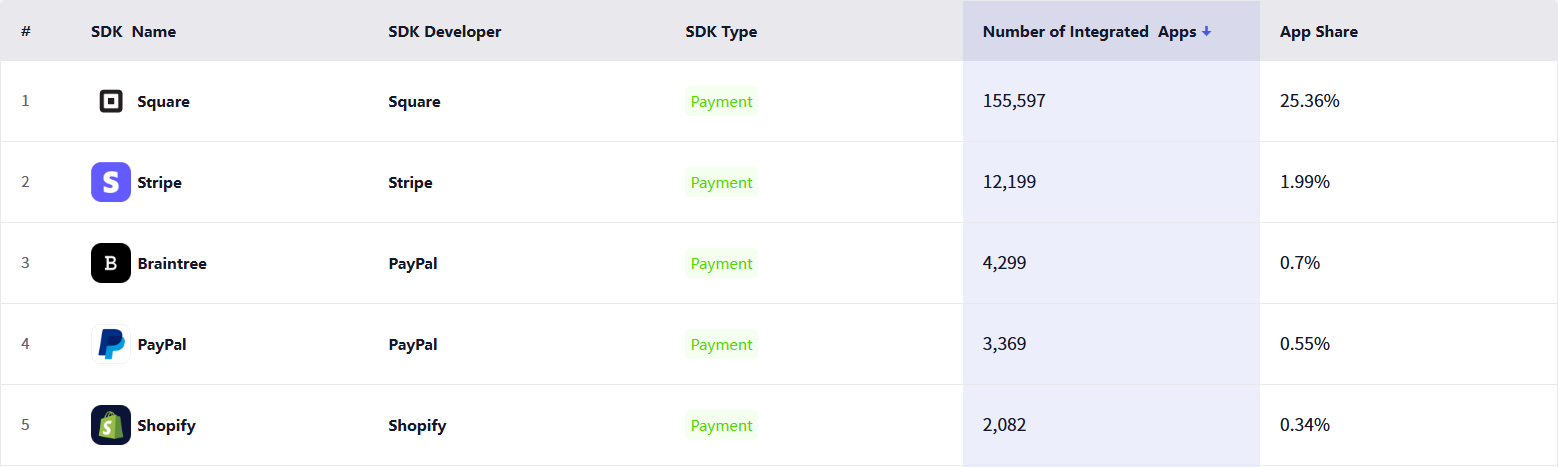
Square’s integration across service apps (booking, food delivery, event management) positions it as a go-to for offline-to-online conversion flows.
What This Means for Developers in 2026
To stay competitive, developers should:
- Evaluate SDK footprints holistically (performance, privacy, and long-term scalability).
- Avoid locked-in ecosystems unless monetization or distribution benefits outweigh the cost.
- Monitor SDK popularity in your category, as dominant SDKs often shape ad fill rates, CPI performance, and analytics standardization.
- Use real-world data, not vendor claims, to compare adoption rates and make evidence-based decisions.
Insightrackr provides an unbiased view of SDK distributions across global app stores—helping teams benchmark their own stacks and catch new trends early.
Conclusion: Build Smarter with Data Backing Every SDK Decision
The SDK landscape in 2026 will be shaped by AI capabilities, privacy requirements, and the need for lighter, cross-platform-ready tooling.
With Insightrackr’s global SDK intelligence, developers and product teams can identify category benchmarks, track emerging trends, and adopt technologies used by top-ranking apps worldwide.
Ready to Explore SDK Trends Deeper?
👉 Visit Insightrackr to access full SDK penetration dashboards, app-level breakdowns, and trend forecasts.
Make every technical decision data-driven—with insights trusted by studios, marketers, and product teams worldwide.